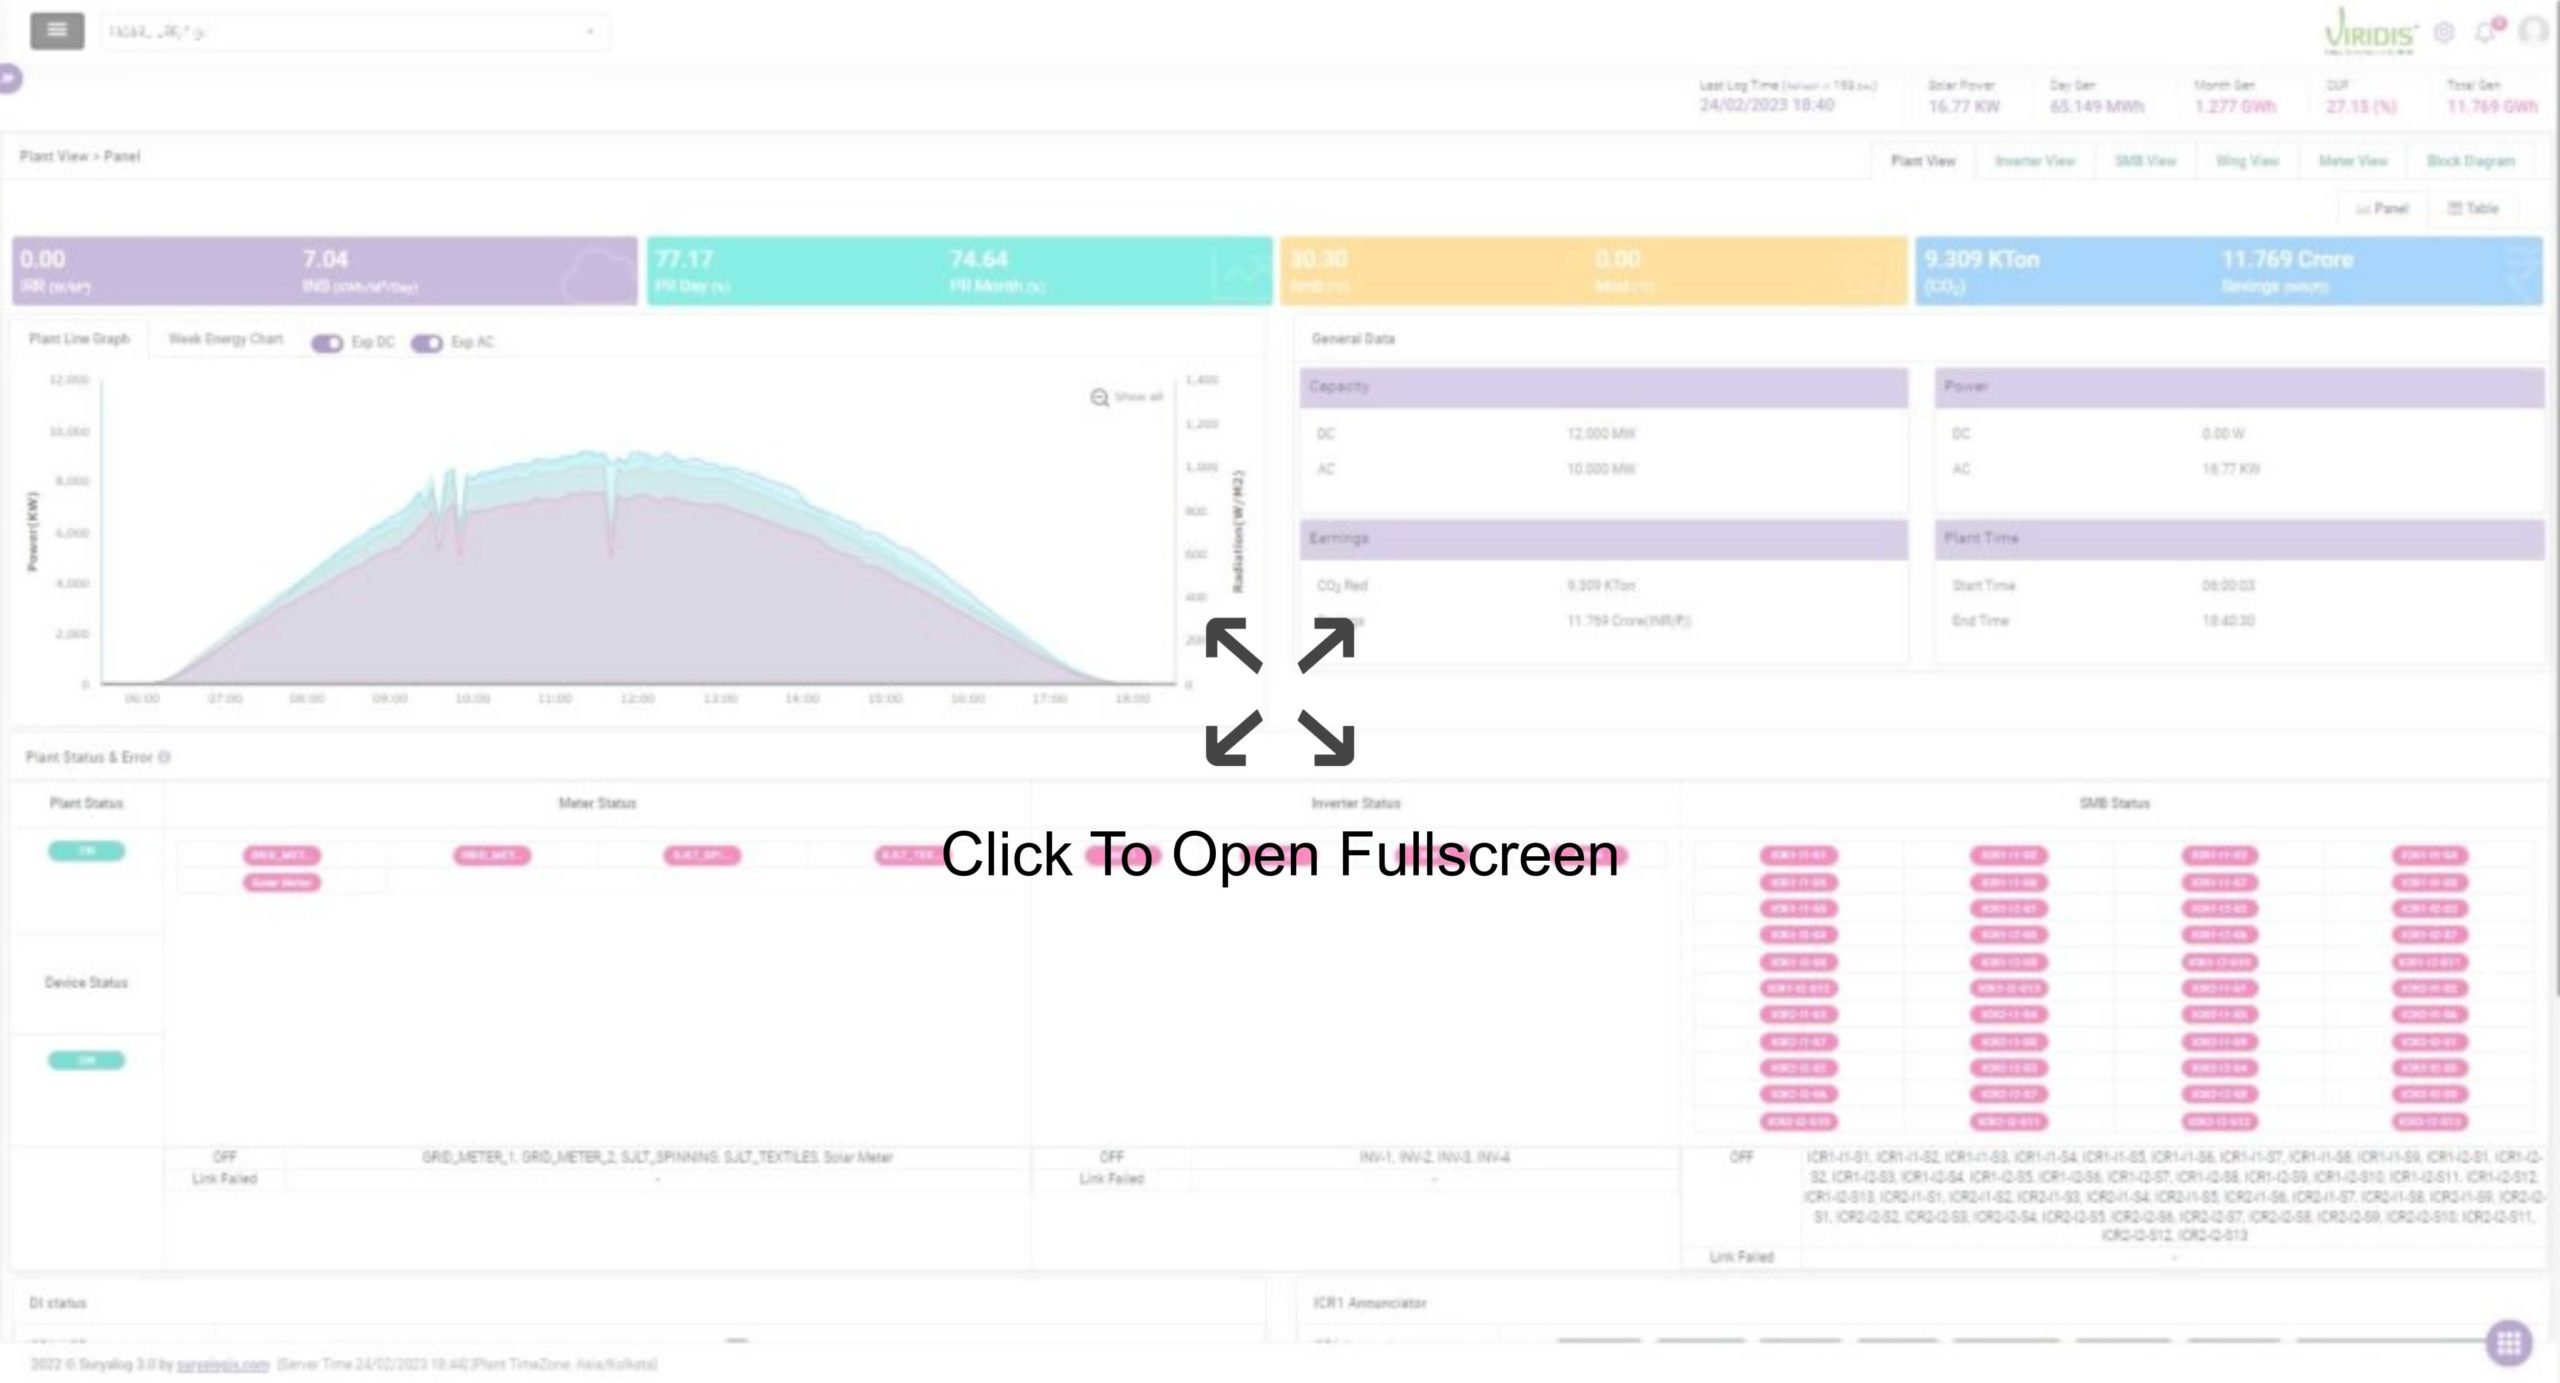

MPPT & String View
Current, Voltage, Power & Temperature

Instances, Graphs & Charts
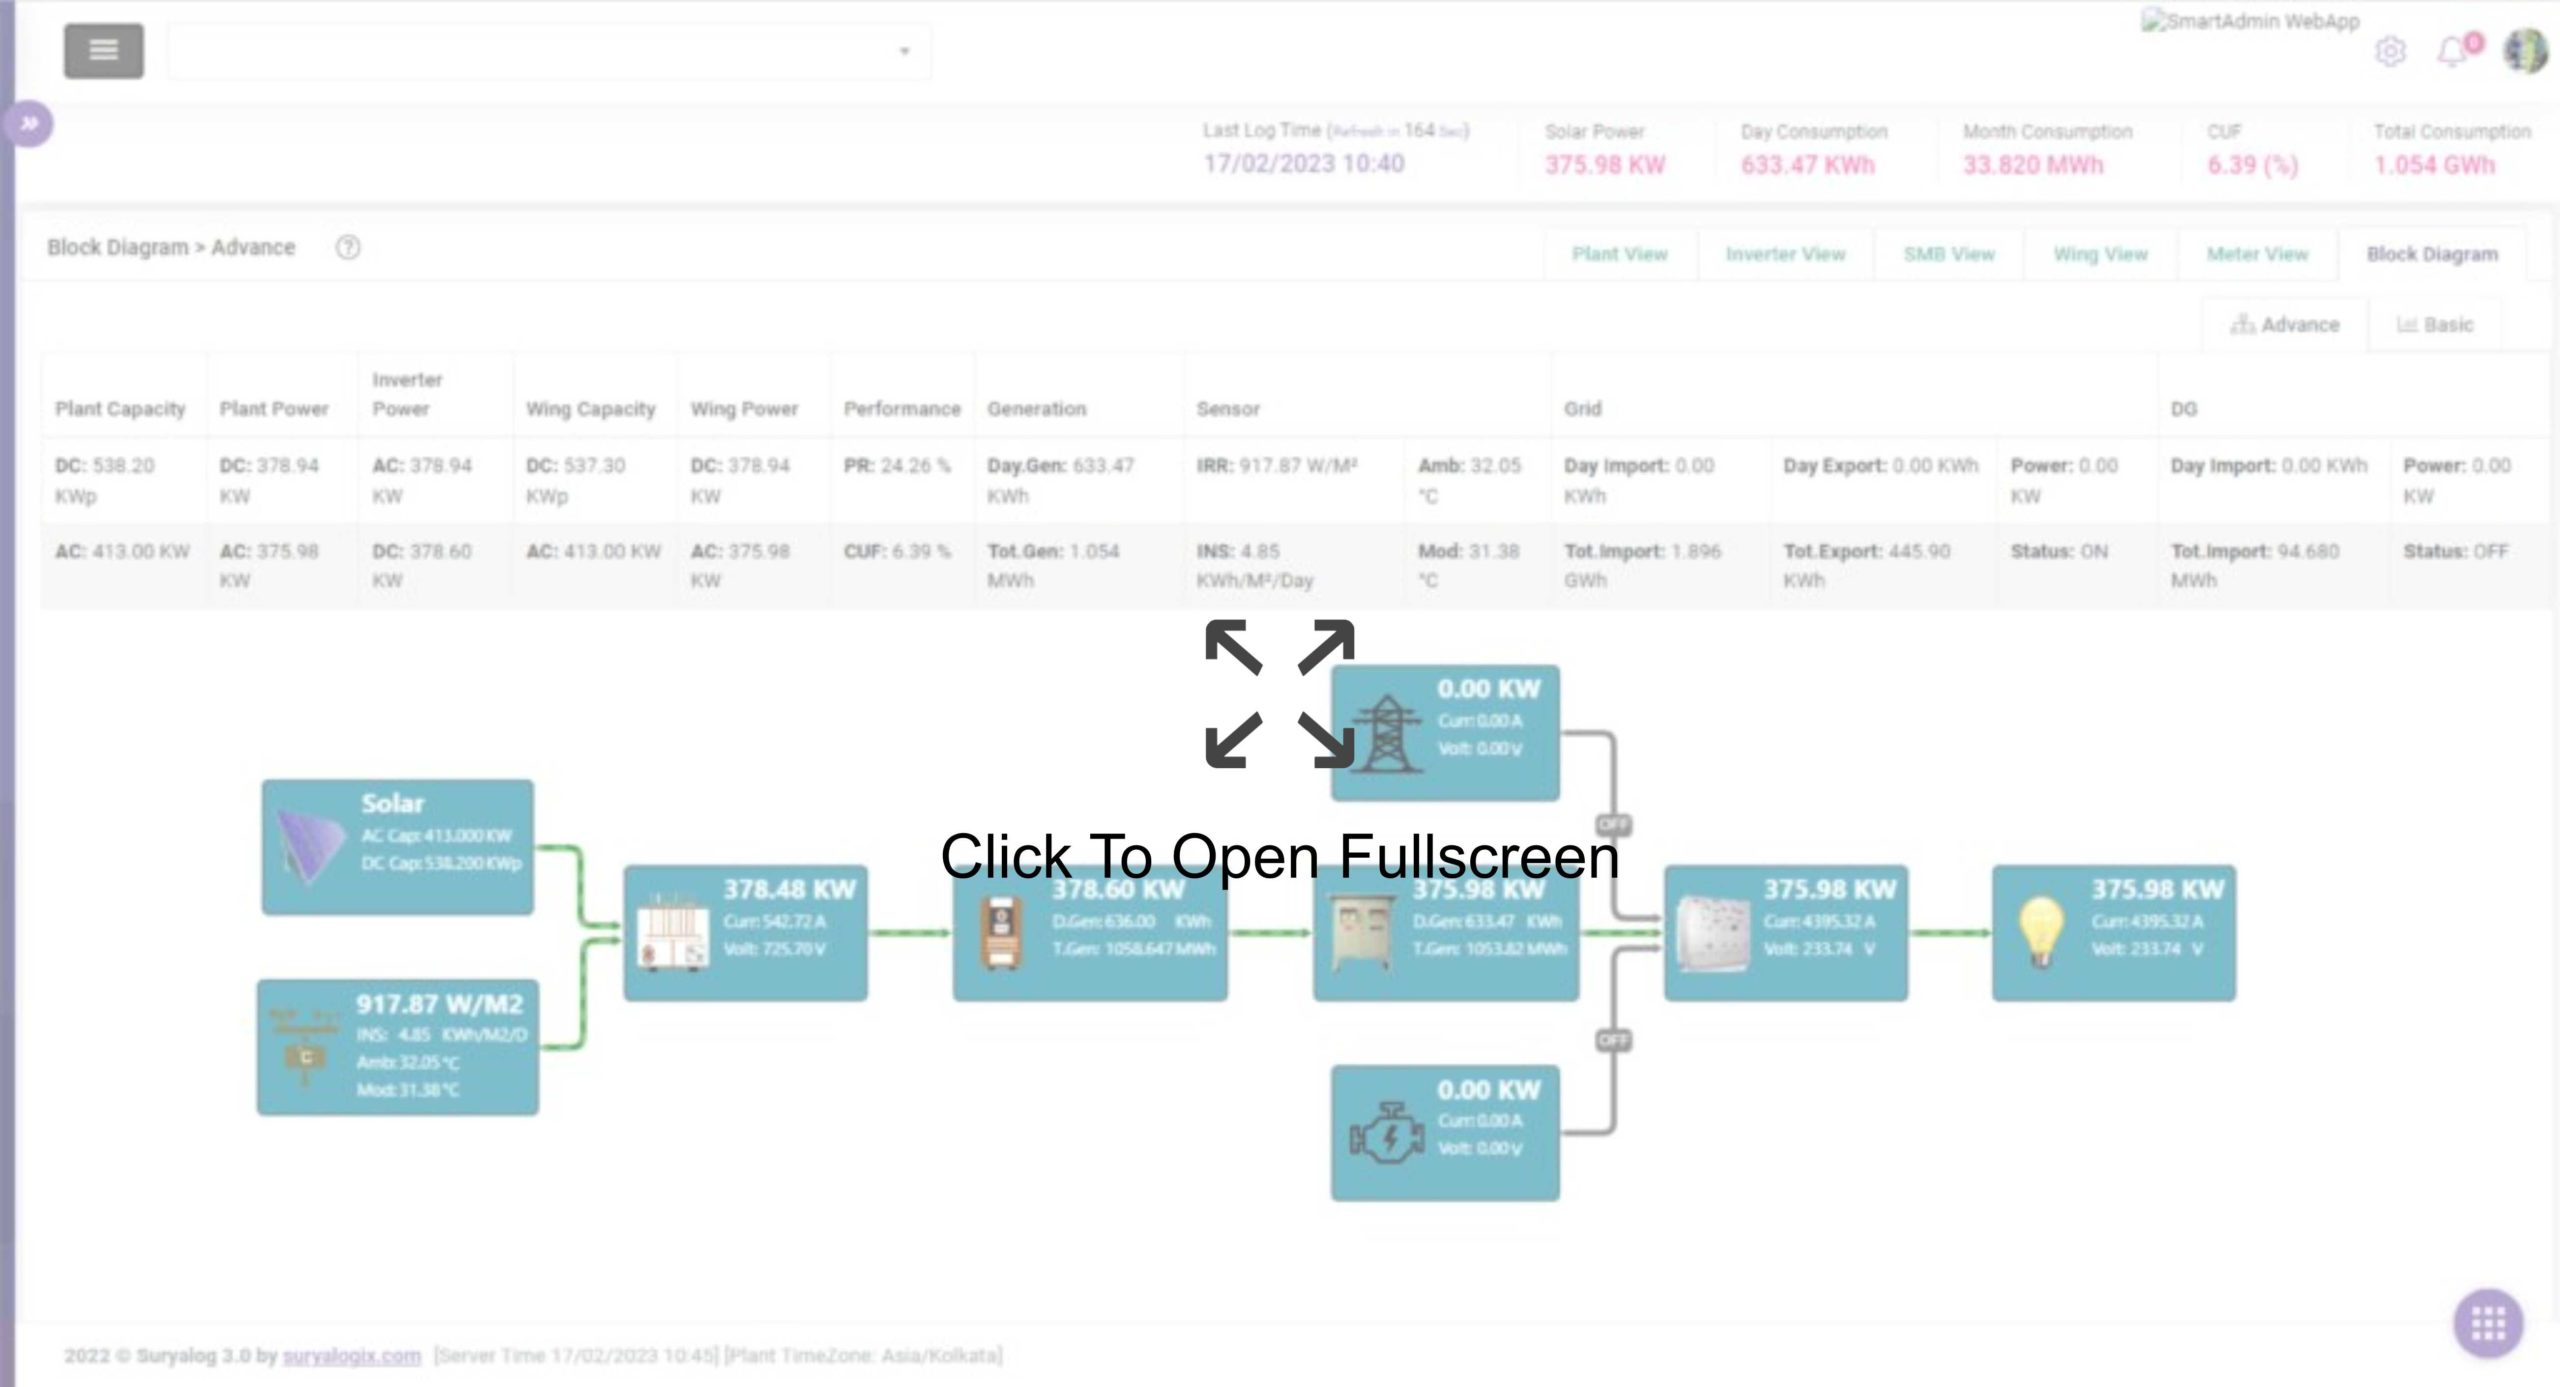
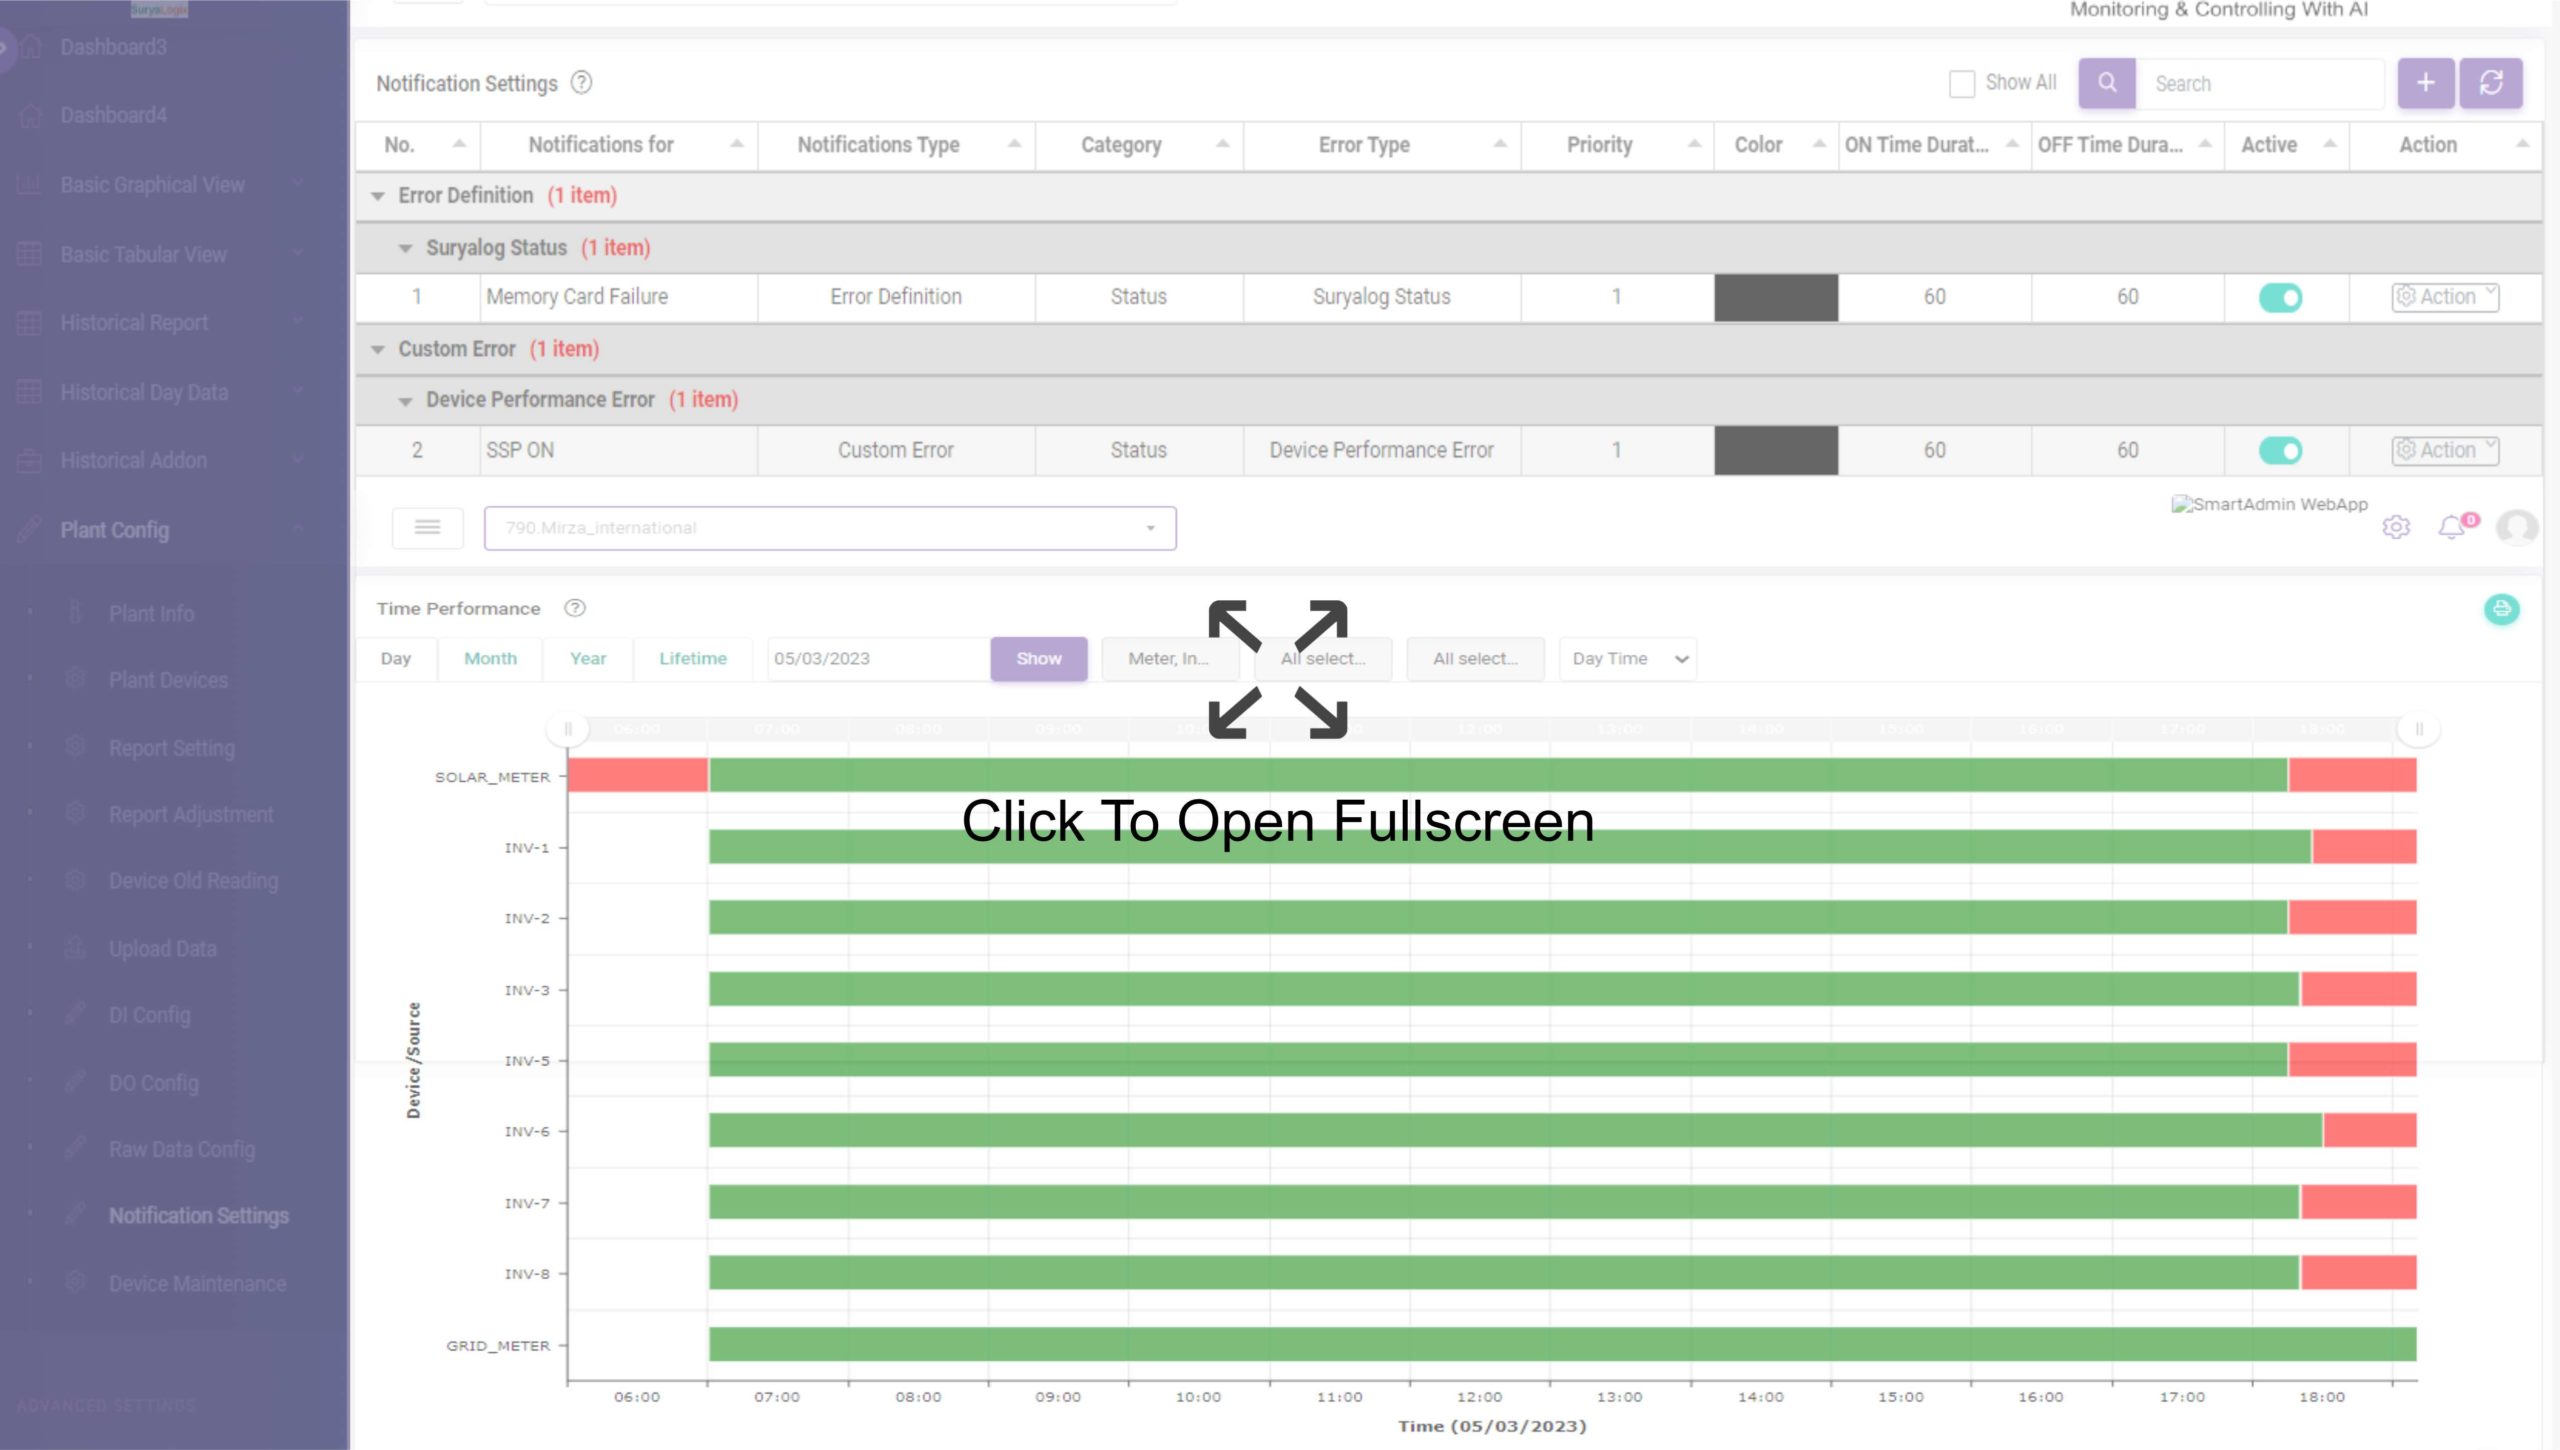
Last log, Start/End, Up/ Down, Block Diagram, Tabular, Bar

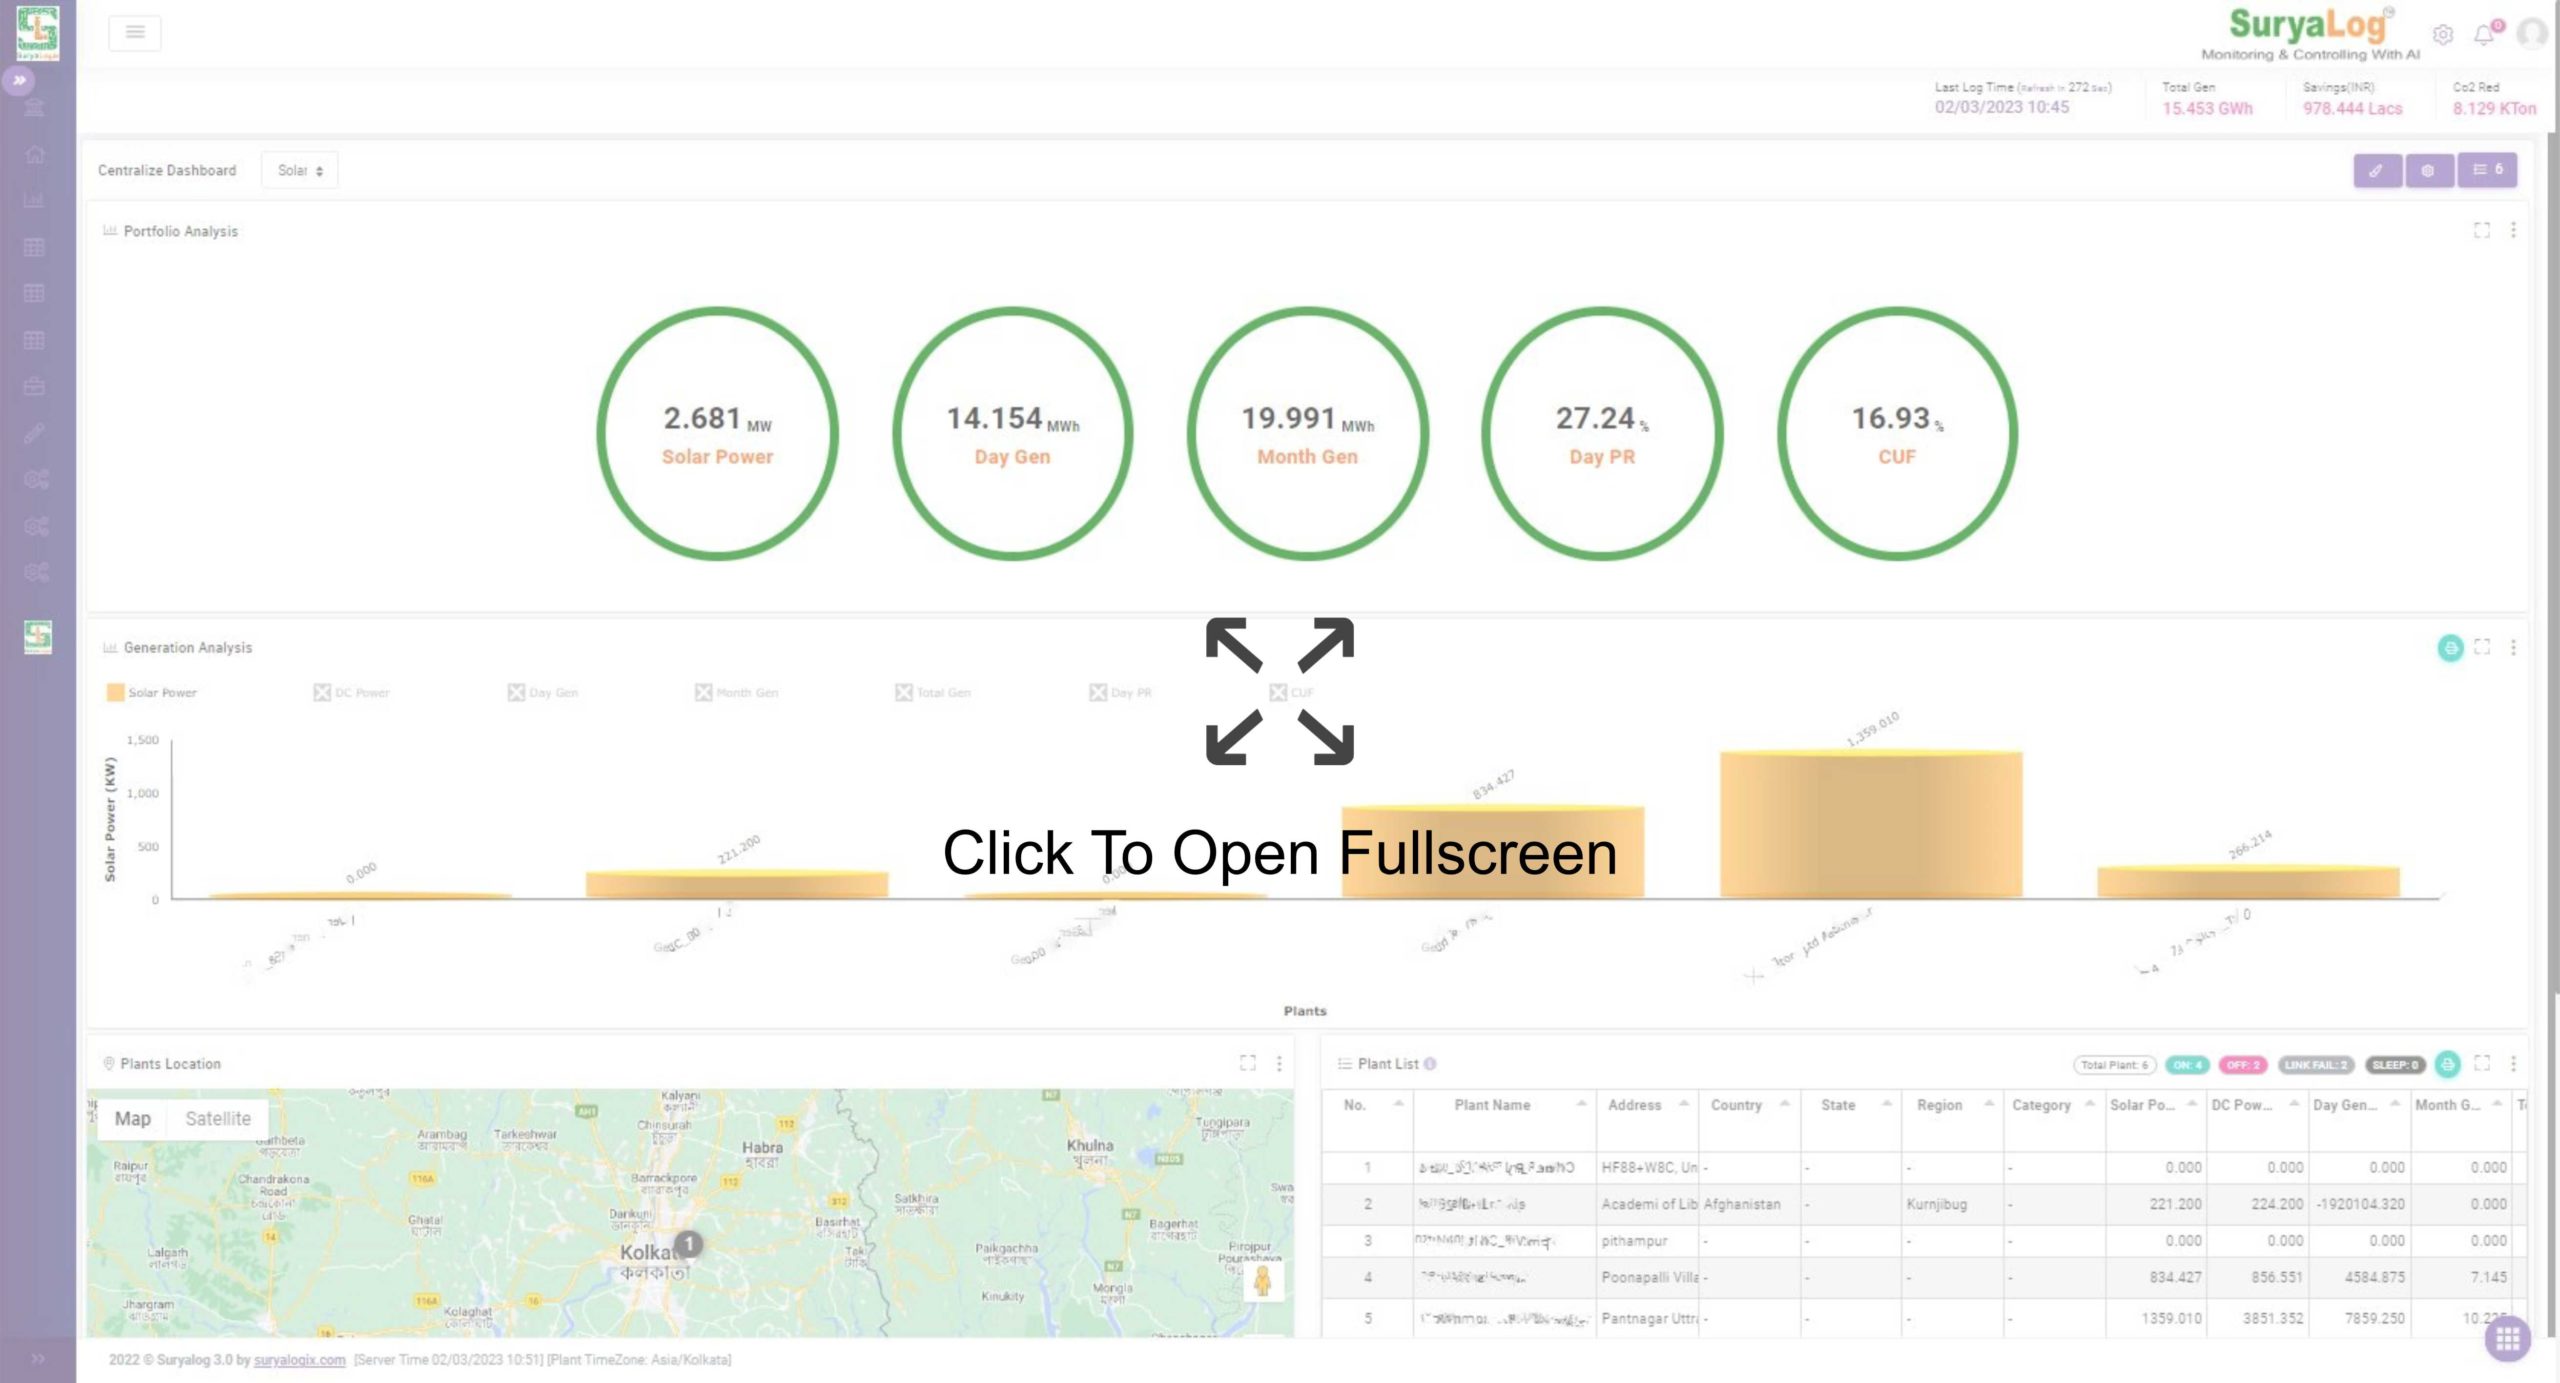
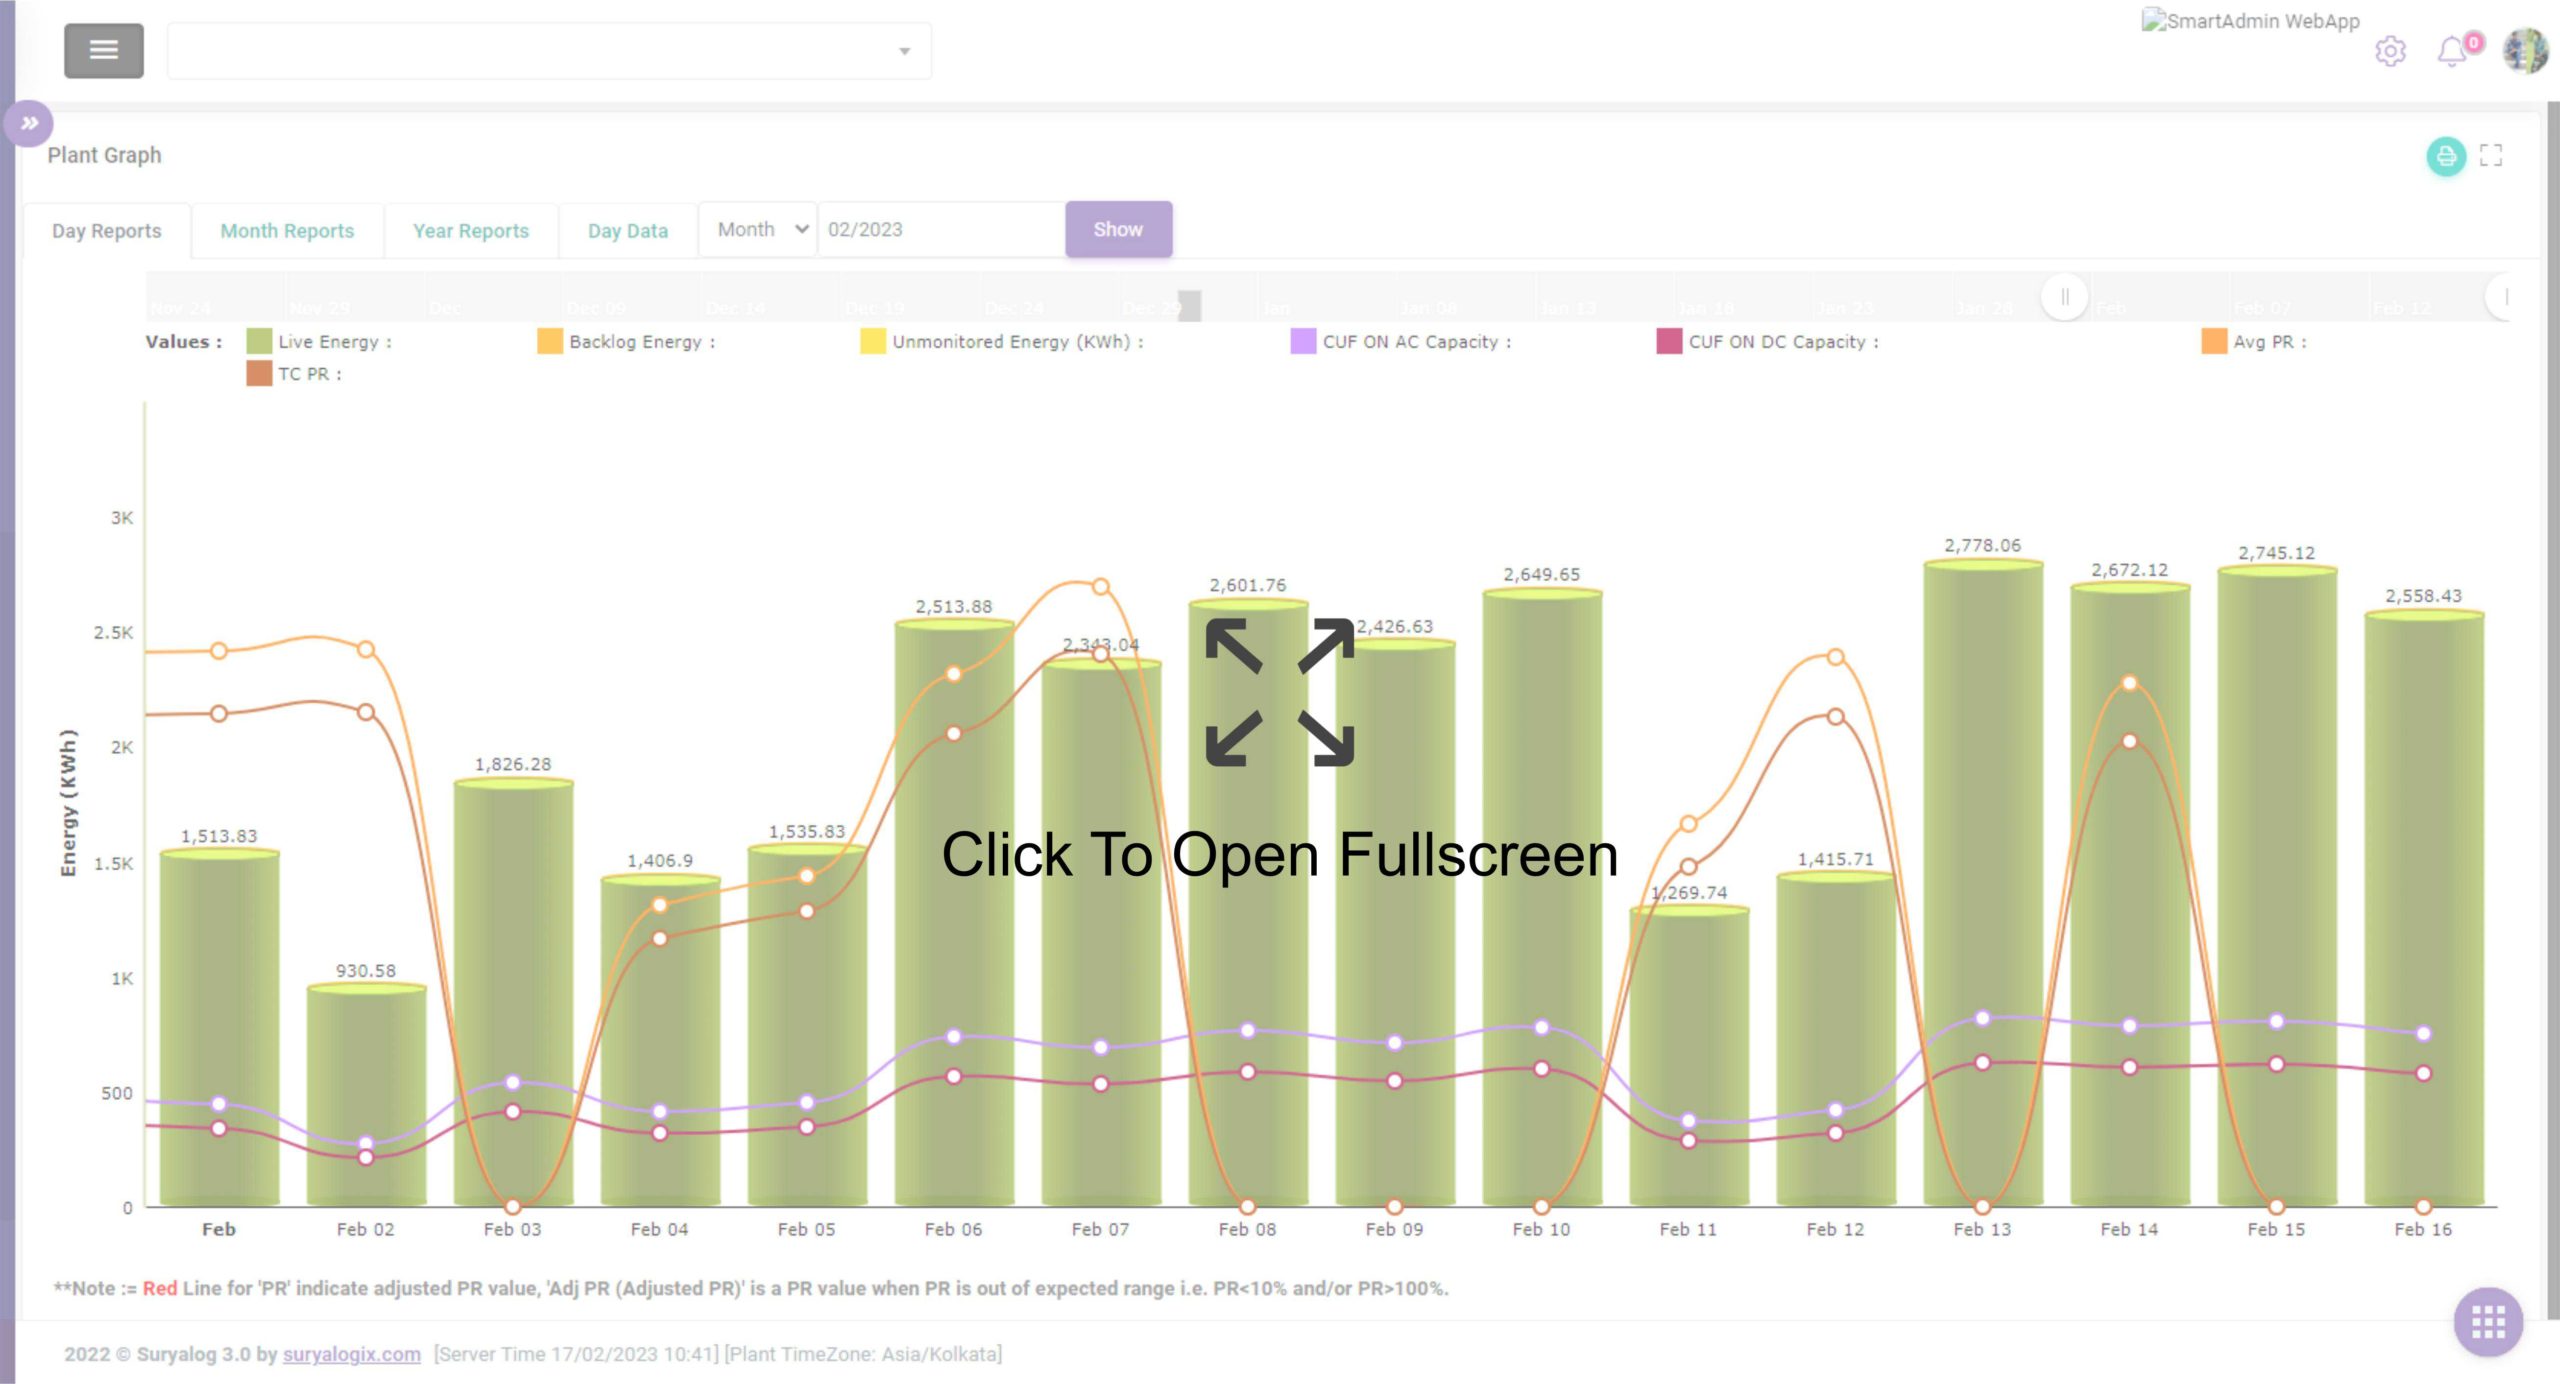
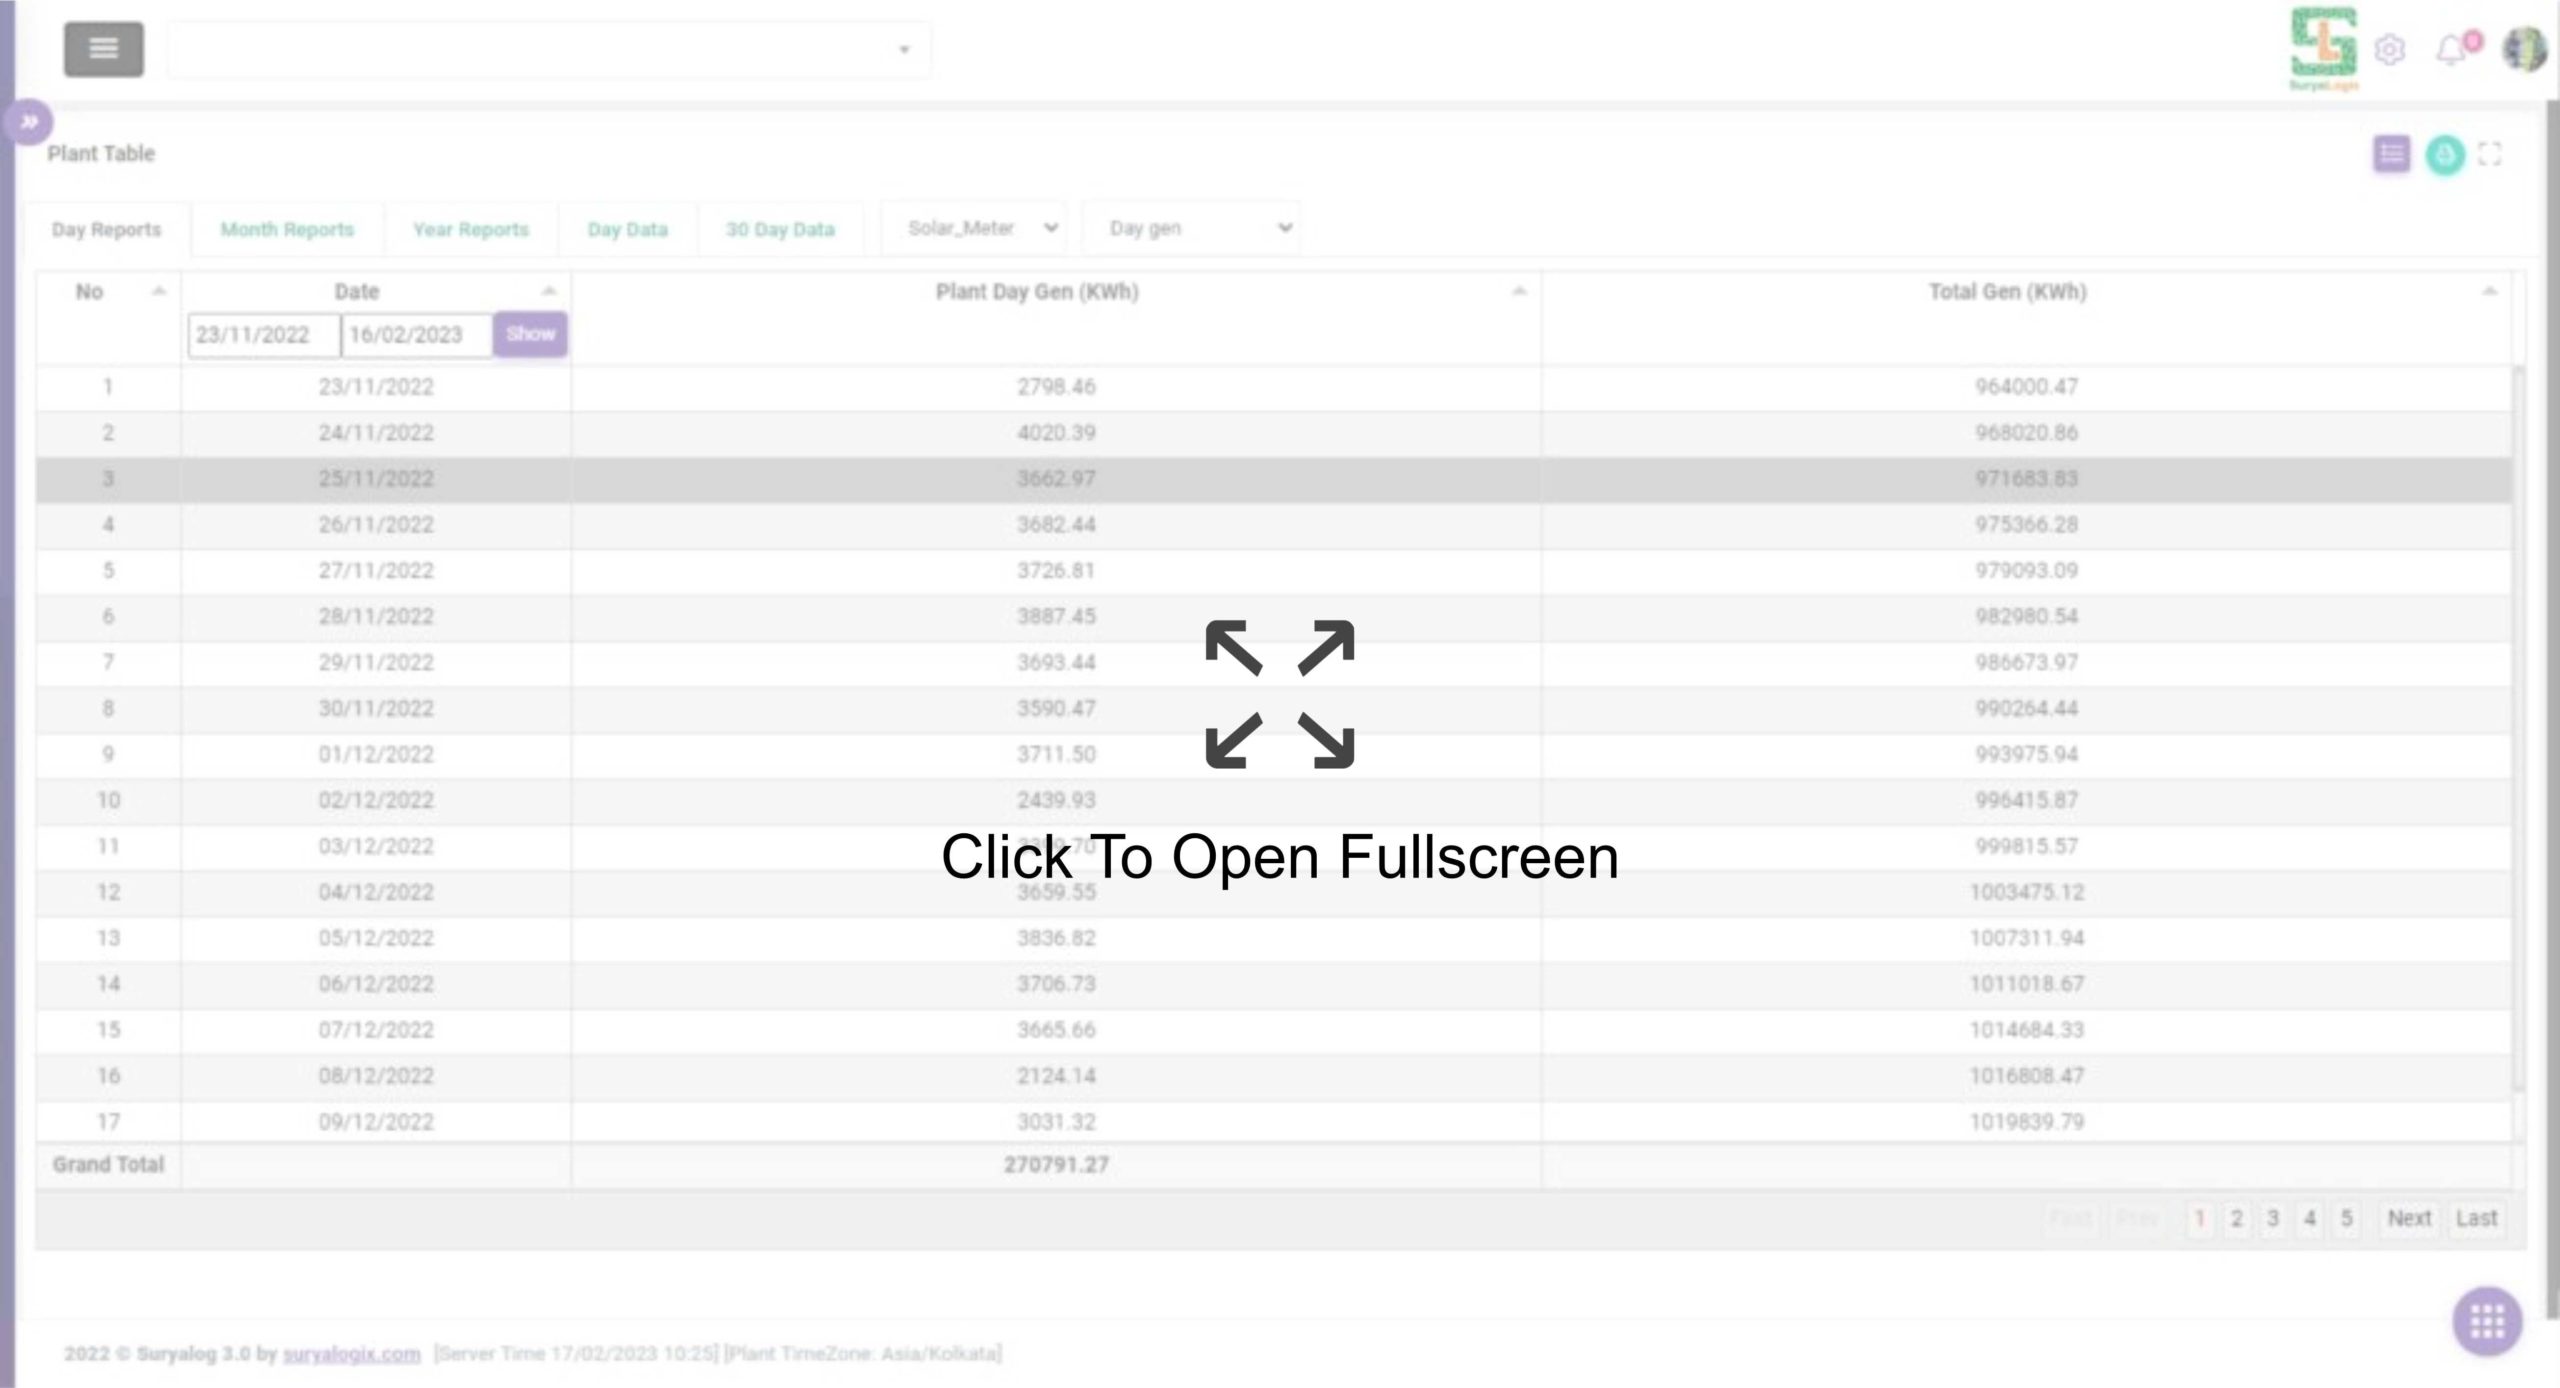
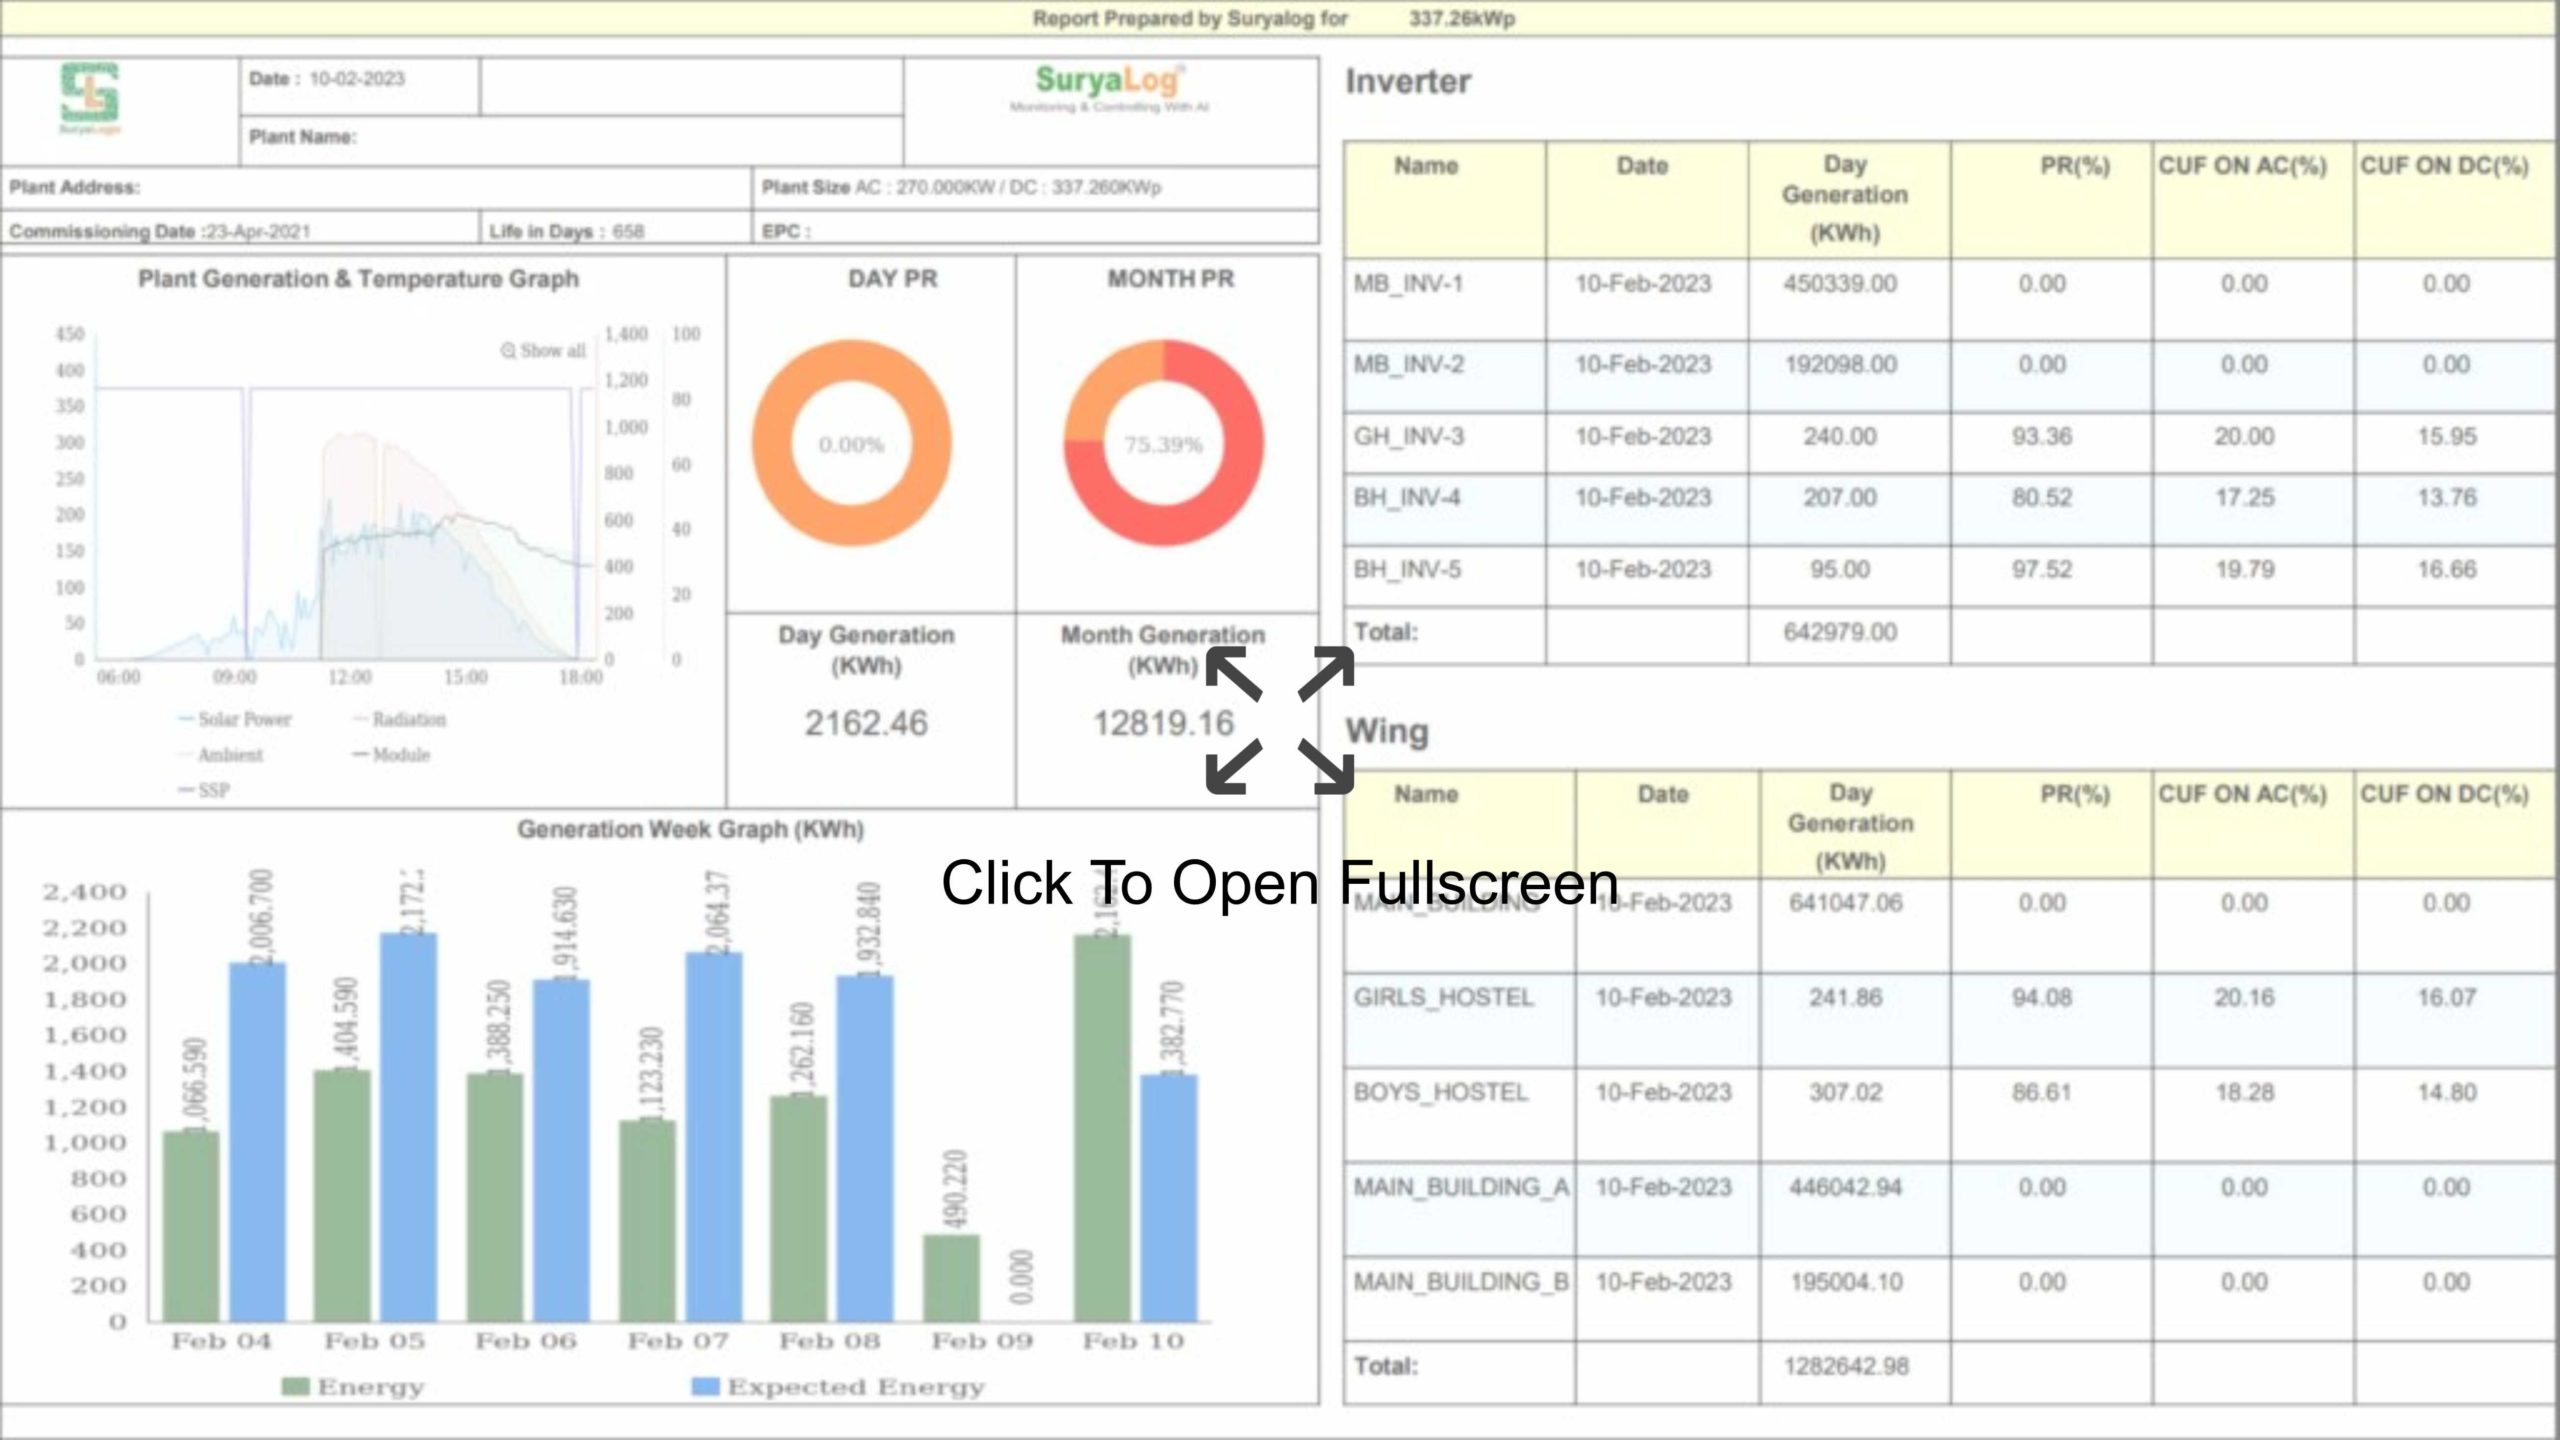
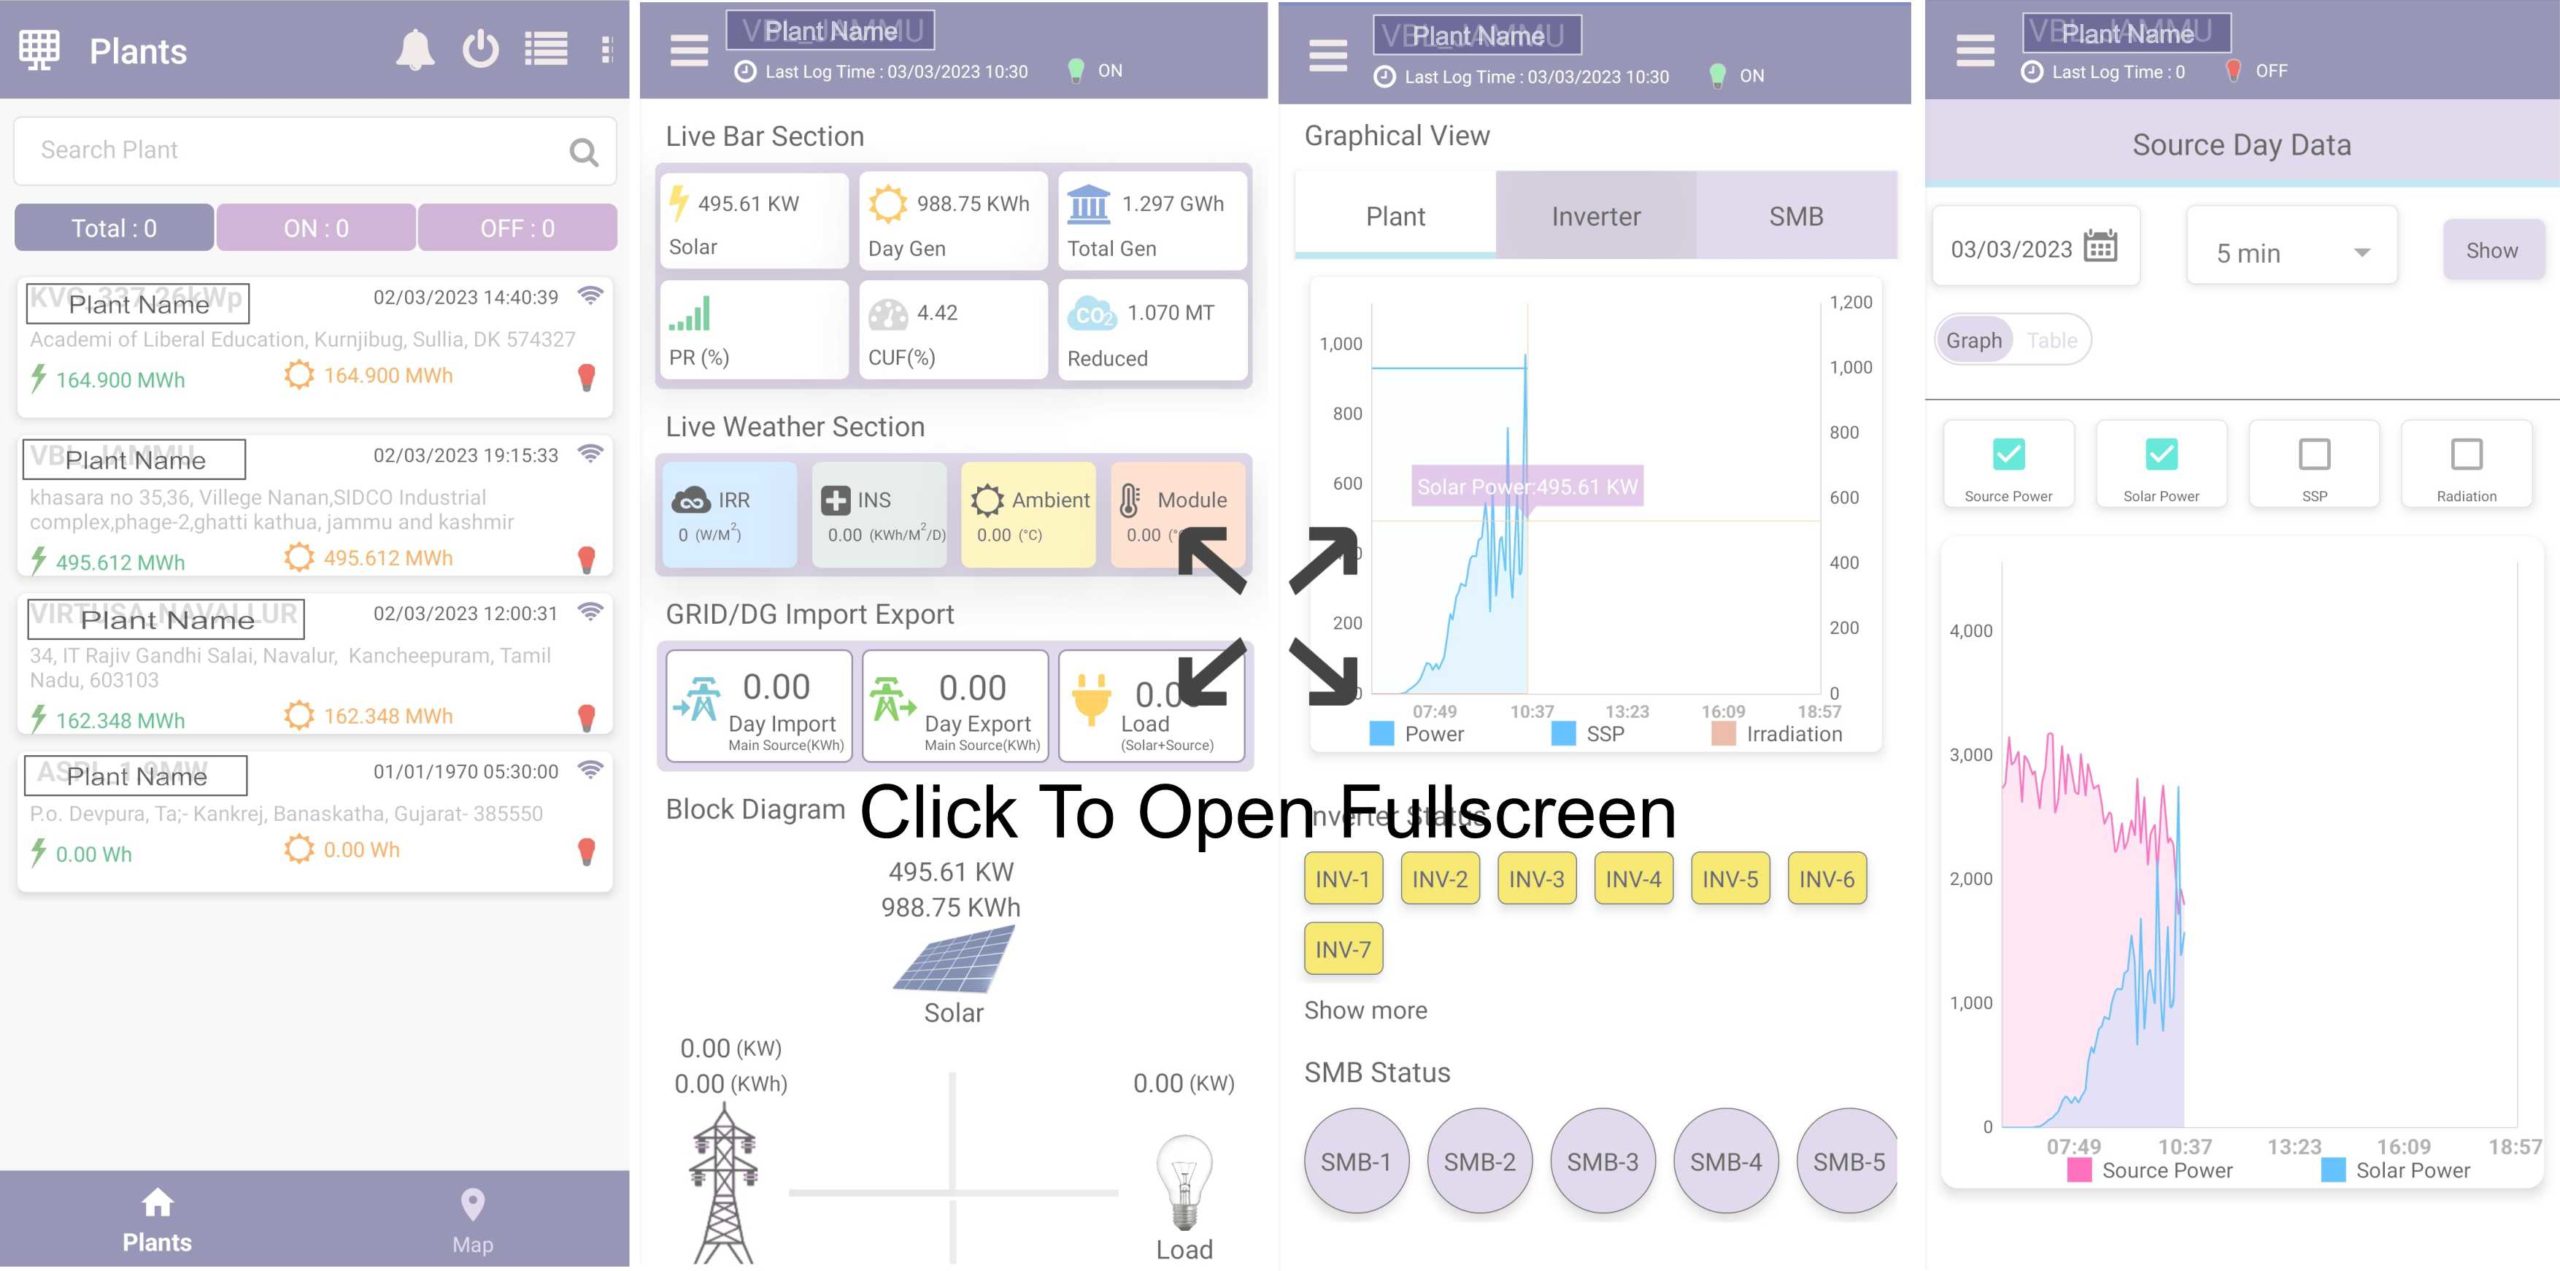
Generation
Total Generation, Day/ Week/Month/Year Generation

Deemed & Committed Gen
Deemed Calculations, PV System Comparison – Actual & Expected

Grid/DG Statistics
Run hours, Solar Energy, Import/Export

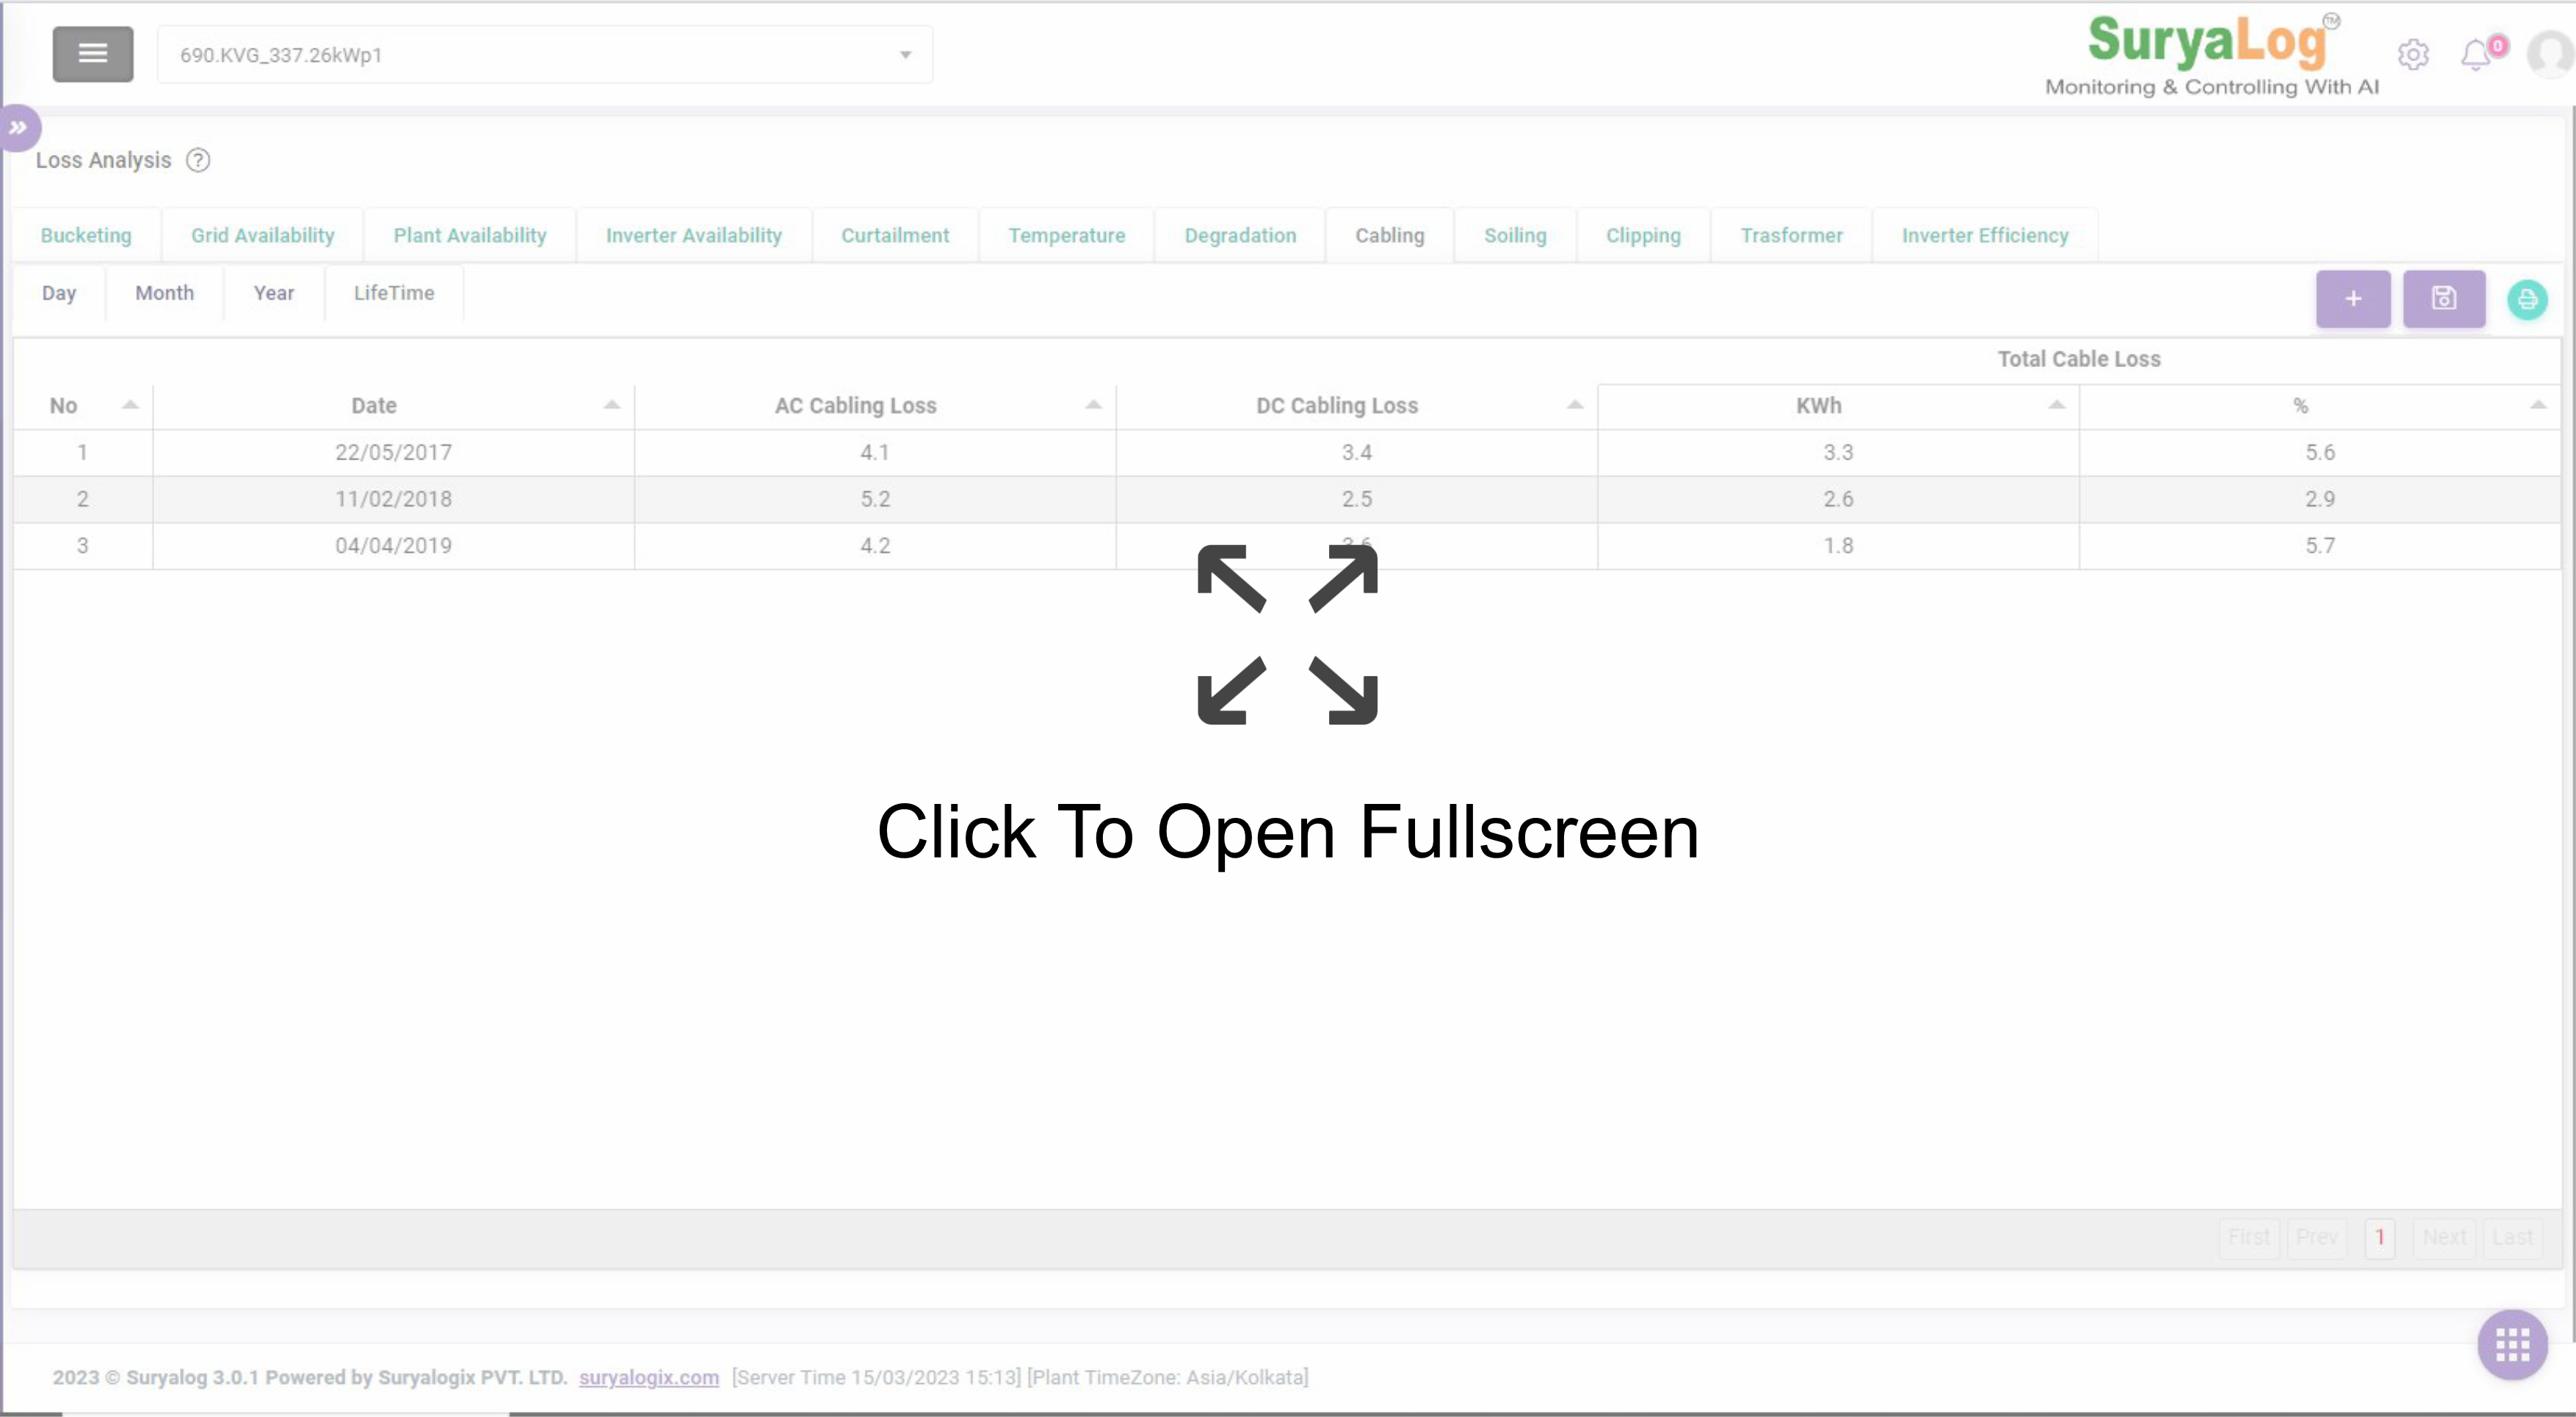
Performances & Losses
CUF, INS, PR, TCPR, Losses

Reports
JMR, Customized, DGR, MGR, Auto Mail, (Excel & PDF)

Source Data
Grid, DG & Load side monitoring with active source

Notifications & Scheduling
Customized, PM & Panel Cleaning Schedules

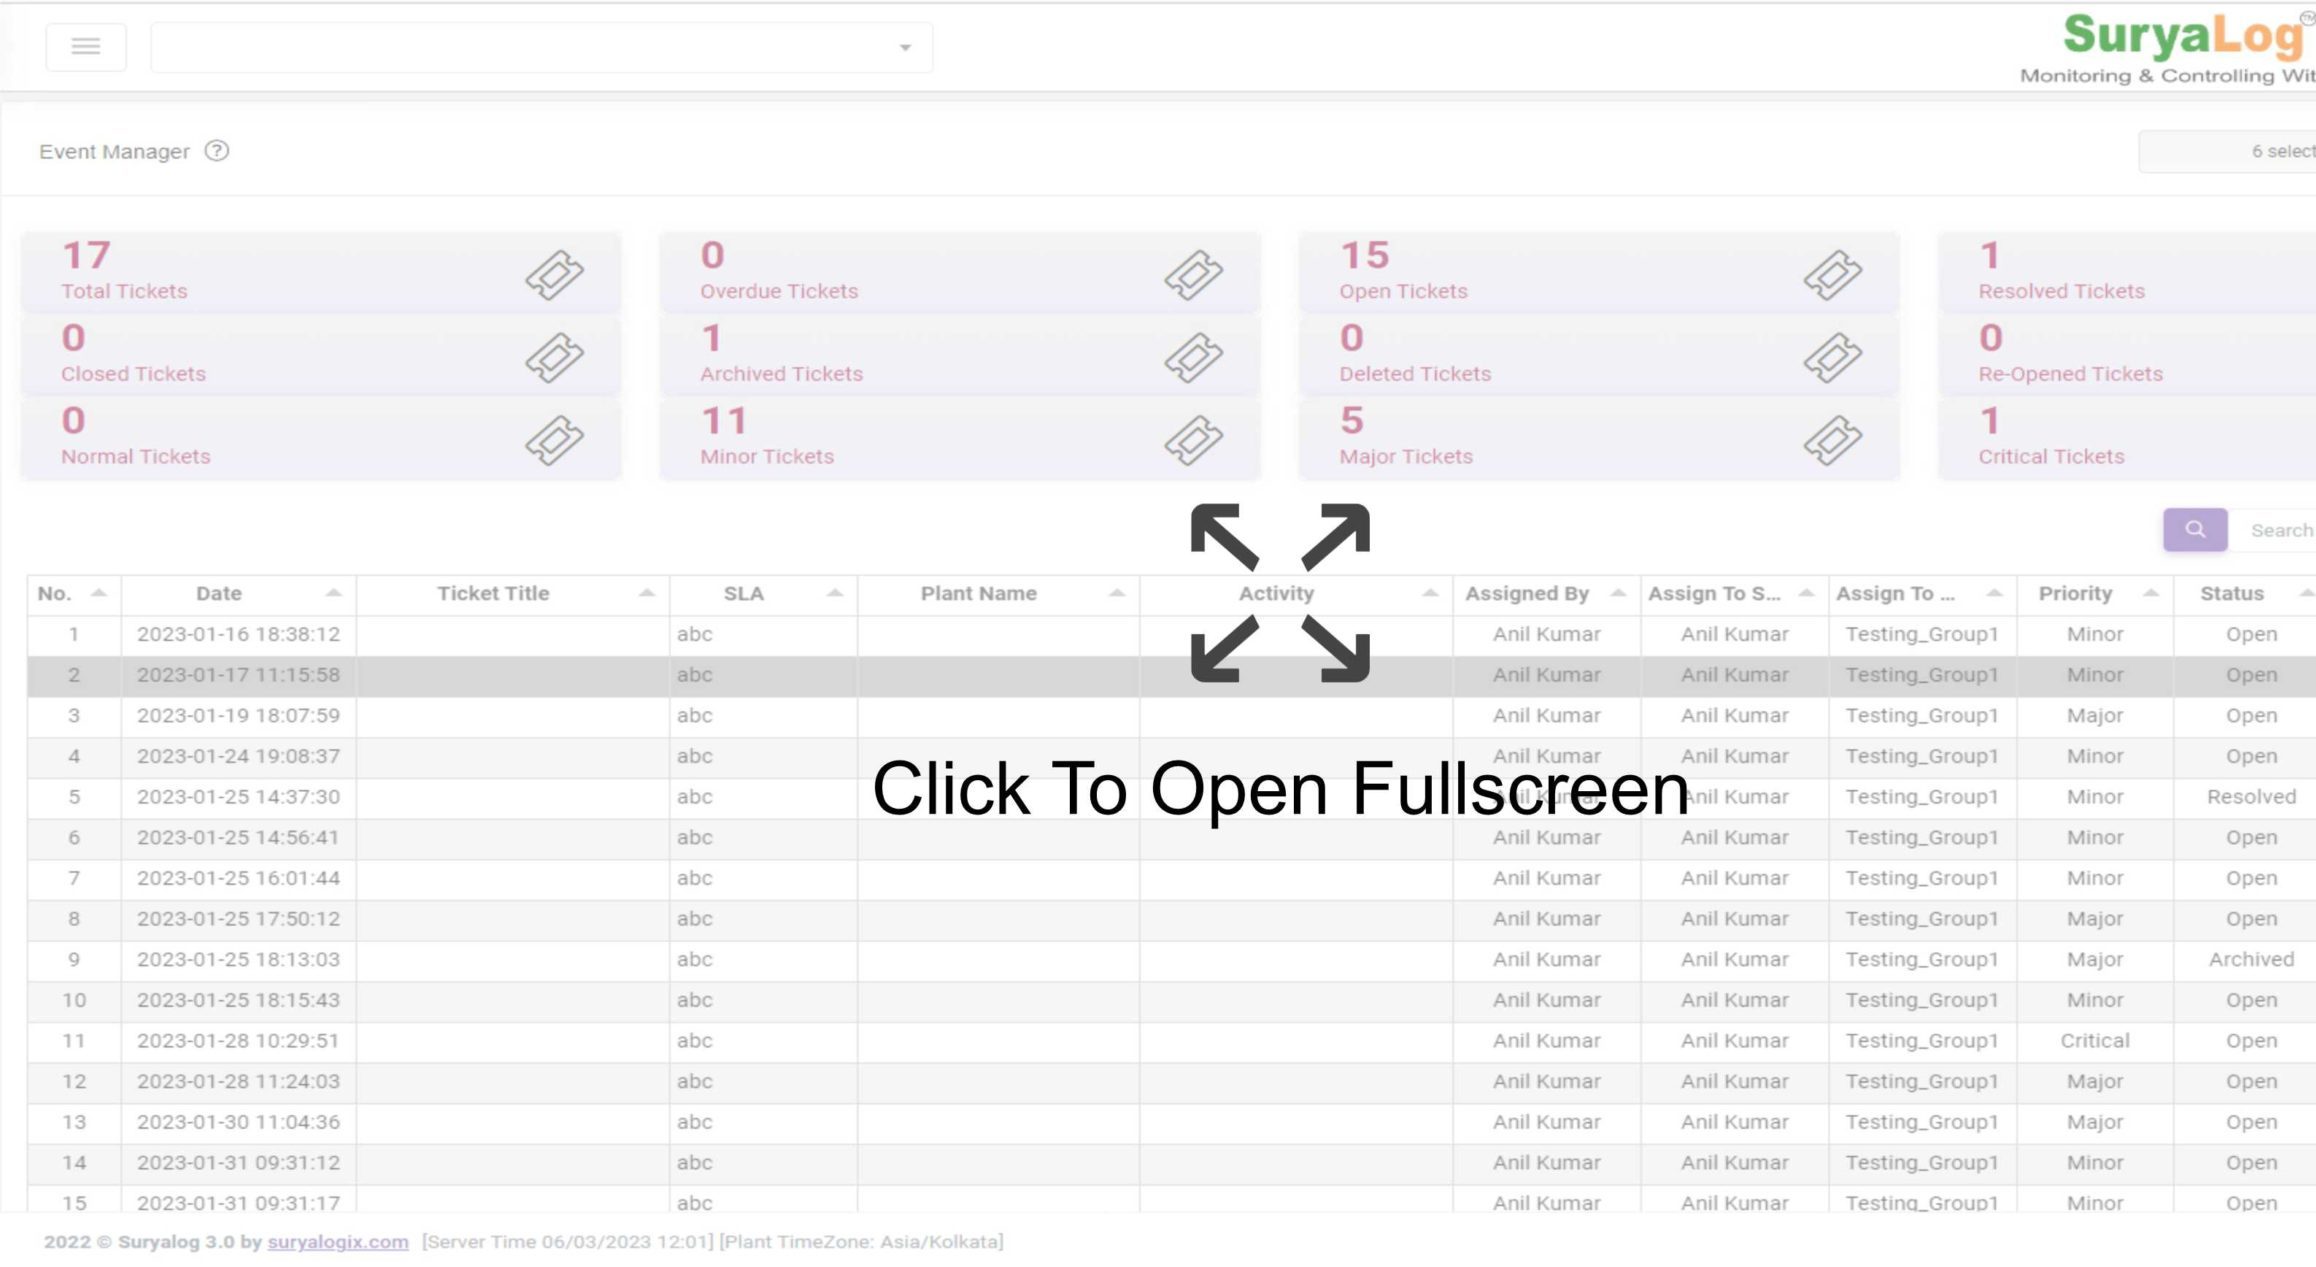
CRM
Spares, Tickets, SLA, Activities Planning & Tracking